
3本のSMA EMAを表示。そして短期線のクロスでアラートを作りました。
他にも、MAがキレイに上か下かで揃っている、いわゆる「パーフェクトオーダー」もアラートで鳴らせます。
無料で、確認不要で使っていただけます。
2026/1/13 以前のMAクロスは不具合があったのでリニューアルして作り直しました。
実際のインジケーター画面はこちら。
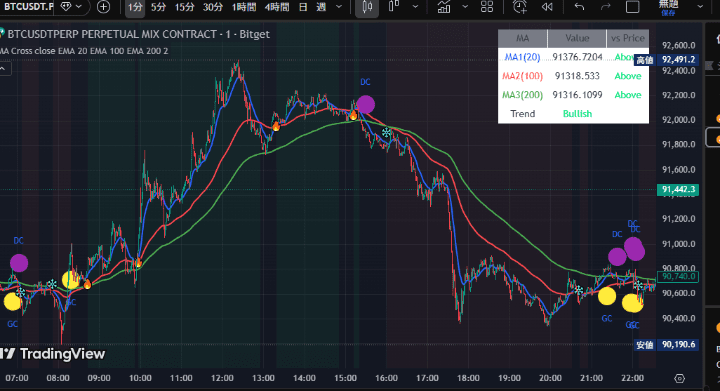
マークの種類と意味
1. GC(黄色い○)|Golden Cross(ゴールデンクロス)
MA1(赤線)がMA3(青線)を下から上に抜けた → 最強の買いシグナル
2. DC(紫色の○)|Death Cross(デッドクロス)
MA1(赤線)がMA3(青線)を上から下に抜けた → 最強の売りシグナル
3. 上昇のパーフェクトオーダー(🔥)|Bullish Alignment(強気アライメント)
全てのMAが上昇順に並んだ(赤線 > 緑線 > 青線)→ 強い上昇トレンド確定
4. 下降のパーフェクトオーダー(❄️)|Bearish Alignment(弱気アライメント)
全てのMAが下降順に並んだ(赤線 < 緑線 < 青線)→ 強い下降トレンド確定
それぞれ大事な場面を視覚的に見えやすくしています。
パラメータ画面
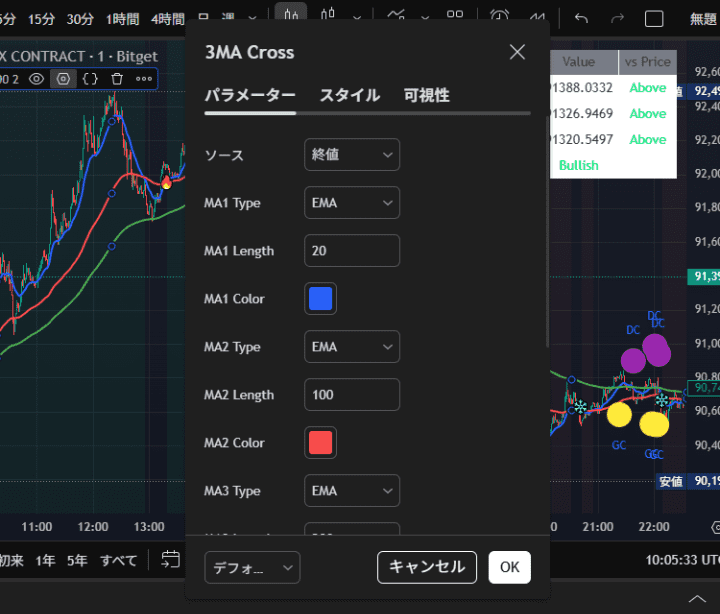
コチラがパラメータ画面。
デフォルトでは、EMAの20、100、200にしていますが、好みで変更してください。
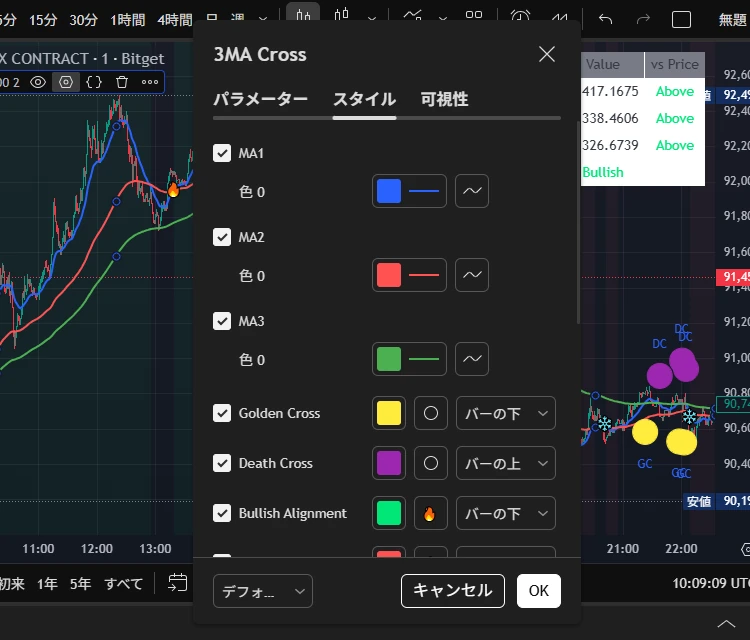
コチラがスタイル画面。
各線の色や太さ、マークの表示非表示などが行えます。
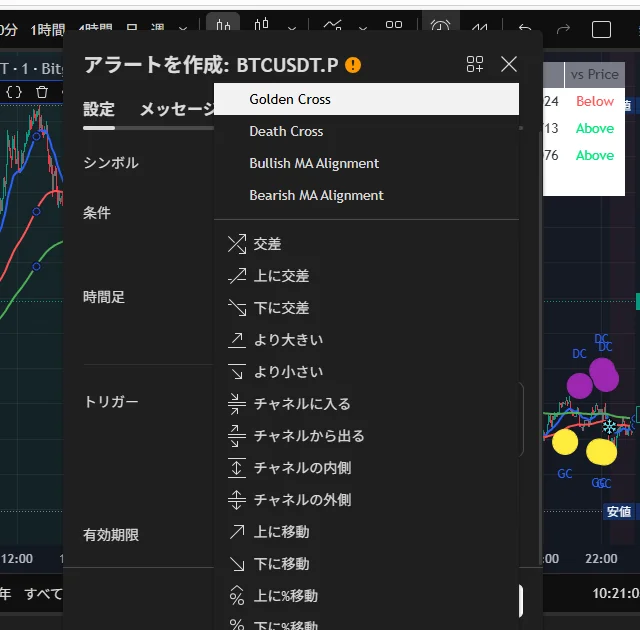
3MA CROSSアラートアラート(全4種)
1. Golden Cross(ゴールデンクロス)
MA1(赤線)がMA3(青線)を下から上に突き抜けた瞬間
買いシグナル。短期が長期を上抜けた(GCマーク表示)
2. Death Cross(デッドクロス)
MA1(赤線)がMA3(青線)を上から下に突き抜けた瞬間
売りシグナル。短期が長期を下抜けた(DCマーク表示)
3. Bullish MA Alignment(強気アライメント)
MA1 > MA2 > MA3(赤線 > 緑線 > 青線)の順番に並んだ瞬間
強力な上昇トレンド確定(🔥マーク表示)
4. Bearish MA Alignment(弱気アライメント)
MA1 < MA2 < MA3(赤線 < 緑線 < 青線)の順番に並んだ瞬間
強力な下降トレンド確定(❄️マーク表示)
MAの数値はパラメータ画面で変更できます。
アラートも変更した数値によって変動します。
3MA CROSSアラート コード
※2025/9 表示がズレていたので修正しました。
2026/1 リニューアルして作り直しました。
//@version=5
indicator("3MA Cross Indicator", shorttitle="3MA Cross", overlay=true)

// インプット設定
src = input.source(close, title="Source")

// MA1設定
maType1 = input.string("EMA", title="MA1 Type", options=["EMA", "SMA", "WMA", "RMA"])
length1 = input.int(20, title="MA1 Length", minval=1, maxval=500)
color1 = input.color(color.blue, title="MA1 Color")

// MA2設定
maType2 = input.string("EMA", title="MA2 Type", options=["EMA", "SMA", "WMA", "RMA"])
length2 = input.int(100, title="MA2 Length", minval=1, maxval=500)
color2 = input.color(color.red, title="MA2 Color")

// MA3設定
maType3 = input.string("EMA", title="MA3 Type", options=["EMA", "SMA", "WMA", "RMA"])
length3 = input.int(200, title="MA3 Length", minval=1, maxval=500)
color3 = input.color(color.green, title="MA3 Color")

// 表示設定
showMA1 = input.bool(true, title="Show MA1")
showMA2 = input.bool(true, title="Show MA2")
showMA3 = input.bool(true, title="Show MA3")

// 線の太さ設定
lineWidth = input.int(2, title="Line Width", minval=1, maxval=4)

// クロスシグナル設定
showCrossUp = input.bool(true, title="Show Cross Up Signals")
showCrossDown = input.bool(true, title="Show Cross Down Signals")
showMAAlignment = input.bool(true, title="Show MA Alignment Signals")

// MA計算関数
calcMA(source, length, maType) =>
    switch maType
        "EMA" => ta.ema(source, length)
        "SMA" => ta.sma(source, length)
        "WMA" => ta.wma(source, length)
        "RMA" => ta.rma(source, length)
        => ta.ema(source, length) // デフォルト

// MAの計算
ma1 = calcMA(src, length1, maType1)
ma2 = calcMA(src, length2, maType2)
ma3 = calcMA(src, length3, maType3)

// MAのプロット
plot(showMA1 ? ma1 : na, title="MA1", color=color1, linewidth=lineWidth)
plot(showMA2 ? ma2 : na, title="MA2", color=color2, linewidth=lineWidth)
plot(showMA3 ? ma3 : na, title="MA3", color=color3, linewidth=lineWidth)

// ゴールデンクロス/デッドクロス(MA1とMA3の重要なクロス)
goldenCross = ta.crossover(ma1, ma3)
deathCross = ta.crossunder(ma1, ma3)

// MAアライメント条件
bullishAlignment = ma1 > ma2 and ma2 > ma3  // 上昇トレンド
bearishAlignment = ma1 < ma2 and ma2 < ma3  // 下降トレンド

// ゴールデンクロス/デッドクロスシグナル表示
plotshape(showCrossUp and goldenCross, title="Golden Cross", location=location.belowbar,
          style=shape.circle, size=size.normal, color=color.yellow, text="GC")
plotshape(showCrossDown and deathCross, title="Death Cross", location=location.abovebar,
          style=shape.circle, size=size.normal, color=color.purple, text="DC")

// MAアライメントシグナル表示
plotchar(showMAAlignment and bullishAlignment and not bullishAlignment[1], title="Bullish Alignment",
          location=location.belowbar, char="🔥", size=size.tiny, color=color.lime)
plotchar(showMAAlignment and bearishAlignment and not bearishAlignment[1], title="Bearish Alignment",
          location=location.abovebar, char="❄️", size=size.tiny, color=color.red)

// 背景色でトレンド表示
bgcolor(bullishAlignment ? color.new(color.lime, 95) : bearishAlignment ? color.new(color.red, 95) : na, title="Trend Background")

// 【厳選】重要なアラートのみ

// 1. ゴールデンクロス/デッドクロス(最重要)
alertcondition(goldenCross, title="Golden Cross", message="Golden Cross! MA1(20) crossed above MA3(200) - Strong bullish signal!")
alertcondition(deathCross, title="Death Cross", message="Death Cross! MA1(20) crossed below MA3(200) - Strong bearish signal!")

// 2. MAアライメント(トレンド確定)
alertcondition(bullishAlignment and not bullishAlignment[1], title="Bullish MA Alignment", message="All MAs aligned bullish (20>100>200) - Strong uptrend confirmed!")
alertcondition(bearishAlignment and not bearishAlignment[1], title="Bearish MA Alignment", message="All MAs aligned bearish (20<100<200) - Strong downtrend confirmed!")

// 情報テーブル(現在の状態)
if barstate.islast
    var table infoTable = table.new(position.top_right, 3, 5, bgcolor=color.white, border_width=1)
    table.cell(infoTable, 0, 0, "MA", text_color=color.black, bgcolor=color.gray)
    table.cell(infoTable, 1, 0, "Value", text_color=color.black, bgcolor=color.gray)
    table.cell(infoTable, 2, 0, "vs Price", text_color=color.black, bgcolor=color.gray)

    // MA1情報
    ma1Status = src > ma1 ? "Above" : src < ma1 ? "Below" : "Equal"
    ma1StatusColor = src > ma1 ? color.lime : src < ma1 ? color.red : color.gray
    table.cell(infoTable, 0, 1, "MA1(" + str.tostring(length1) + ")", text_color=color1)
    table.cell(infoTable, 1, 1, str.tostring(ma1, "#.####"), text_color=color.black)
    table.cell(infoTable, 2, 1, ma1Status, text_color=ma1StatusColor)

    // MA2情報
    ma2Status = src > ma2 ? "Above" : src < ma2 ? "Below" : "Equal"
    ma2StatusColor = src > ma2 ? color.lime : src < ma2 ? color.red : color.gray
    table.cell(infoTable, 0, 2, "MA2(" + str.tostring(length2) + ")", text_color=color2)
    table.cell(infoTable, 1, 2, str.tostring(ma2, "#.####"), text_color=color.black)
    table.cell(infoTable, 2, 2, ma2Status, text_color=ma2StatusColor)

    // MA3情報
    ma3Status = src > ma3 ? "Above" : src < ma3 ? "Below" : "Equal"
    ma3StatusColor = src > ma3 ? color.lime : src < ma3 ? color.red : color.gray
    table.cell(infoTable, 0, 3, "MA3(" + str.tostring(length3) + ")", text_color=color3)
    table.cell(infoTable, 1, 3, str.tostring(ma3, "#.####"), text_color=color.black)
    table.cell(infoTable, 2, 3, ma3Status, text_color=ma3StatusColor)

    // トレンド情報
    trendStatus = bullishAlignment ? "Bullish" : bearishAlignment ? "Bearish" : "Neutral"
    trendColor = bullishAlignment ? color.lime : bearishAlignment ? color.red : color.gray
    table.cell(infoTable, 0, 4, "Trend", text_color=color.black)
    table.cell(infoTable, 1, 4, trendStatus, text_color=trendColor)
    table.cell(infoTable, 2, 4, "", text_color=color.black)
注意してほしいのは、「ゴールデンクロスした!買いだ!!」で飛びつくのではなく、あくまで指標の一部としてご利用ください。
ご自身の手法をわかりやすくするのにご利用いただけたと思います。
あと、MT4やMT5など他のツールでチャートを見ている方はぜひ一度TradingViewを見てみてください。
無料でも十分多機能で使いやすさはダントツです。


コメント