RSIの買われすぎ売られすぎラインに到達すると、アラートで知らせてくれるインジケーターを作りました。
無料で、確認不要で使っていただけます。
デフォルトで搭載されているRSIのインジケーターにアラートを設定することはできたのですが、一度鳴ると消えてしまうので、常に反応できるように改造しました。
RSIアラートインジケーター
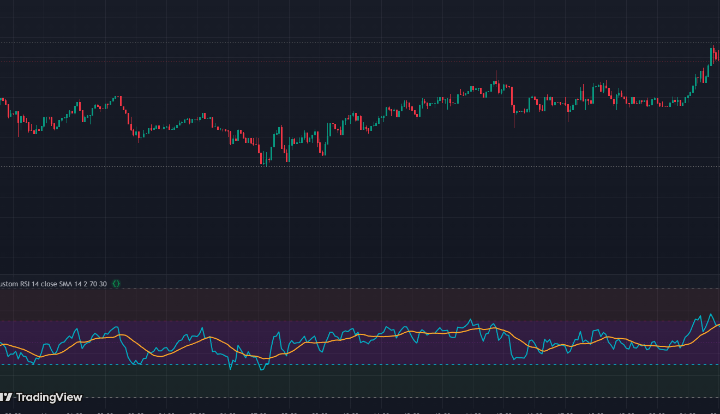
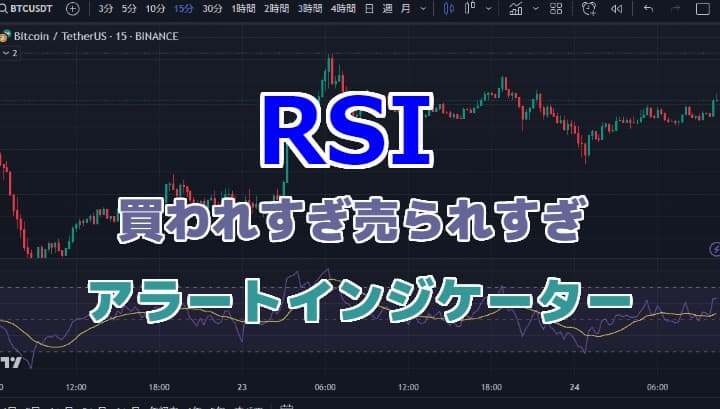
コチラがRSIのアラートインジケーターの画面。
計算方法は一般的なRSIと変わりませんが、買われ過ぎ売られ過ぎの部分のデザインなどを変えてあります。
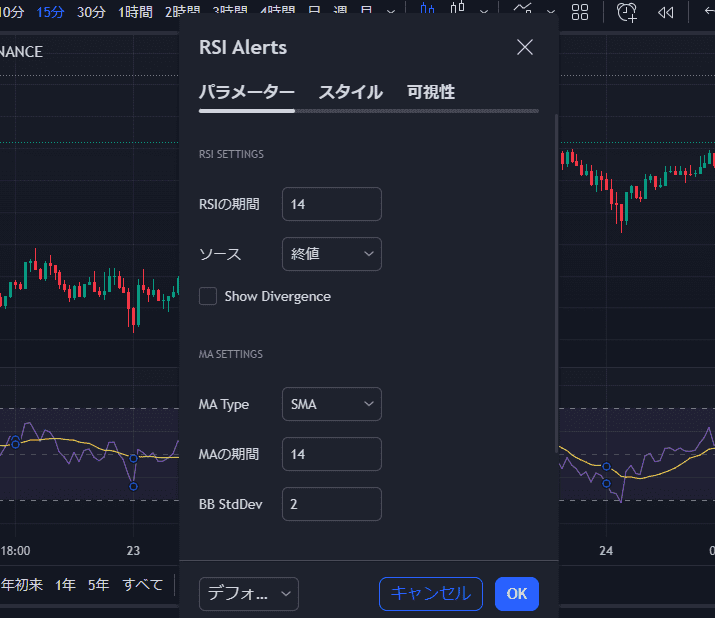
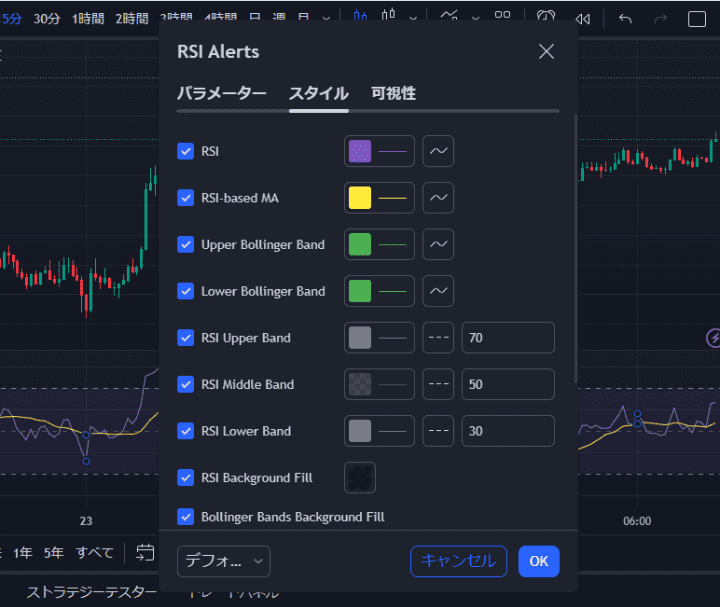
コチラがパラメータ画面とスタイル画面。コチラも基本的には変わりませんね。
期間や色の変更、買われすぎ売られすぎラインの位置を変更できます。
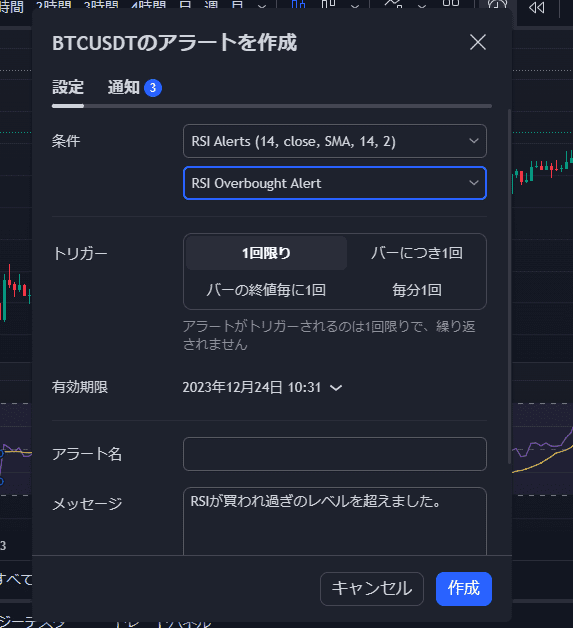
コチラがアラート画面。条件が満たされると、「RSIが買われすぎのレベルを超えました」とアラート画面に表示されます。
スマホなどだと待ち受けに出てくるので分かりやすいですね。
アラートの種類
このRSIインジケーターには4種類のアラートが設定されています:
- RSI Overbought Alert(買われ過ぎアラート) RSIが70を下から上に突き抜けた瞬間
- RSI Oversold Alert(売られ過ぎアラート) RSIが30を上から下に突き抜けた瞬間
- RSI Crosses Above MA(RSIが移動平均線を上抜け) RSI線が移動平均線を下から上に突き抜けた瞬間
- RSI Crosses Below MA(RSIが移動平均線を下抜け) RSI線が移動平均線を上から下に突き抜けた瞬間
それぞれの手法に合わせて使っていただければと思います。
RSIアラートコード
//@version=5
indicator(title="Custom RSI Indicator", shorttitle="Custom RSI", format=format.price, precision=2, timeframe="", timeframe_gaps=true)

// Moving Average Function
ma(source, length, type) =>
    switch type
        "SMA" => ta.sma(source, length)
        "Bollinger Bands" => ta.sma(source, length)
        "EMA" => ta.ema(source, length)
        "SMMA (RMA)" => ta.rma(source, length)
        "WMA" => ta.wma(source, length)
        "VWMA" => ta.vwma(source, length)

// Input Settings
rsiLengthInput = input.int(14, minval=1, title="RSI Length", group="RSI Settings")
rsiSourceInput = input.source(close, "Source", group="RSI Settings")
maTypeInput = input.string("SMA", title="MA Type", options=["SMA", "Bollinger Bands", "EMA", "SMMA (RMA)", "WMA", "VWMA"], group="MA Settings")
maLengthInput = input.int(14, title="MA Length", group="MA Settings")
bbMultInput = input.float(2.0, minval=0.001, maxval=50, title="BB StdDev", group="MA Settings")
showDivergence = input.bool(false, title="Show Divergence", group="RSI Settings")

// Alert Levels
overboughtLevel = input.int(70, minval=50, maxval=100, title="Overbought Level", group="Alert Settings")
oversoldLevel = input.int(30, minval=0, maxval=50, title="Oversold Level", group="Alert Settings")

// Color Settings
rsiColor = input.color(color.new(#00ACC1, 0), title="RSI Line Color", group="Color Settings")
maColor = input.color(color.new(#FFA726, 0), title="MA Line Color", group="Color Settings")
obColor = input.color(color.new(#EF5350, 92), title="Overbought Zone Color", group="Color Settings")
osColor = input.color(color.new(#66BB6A, 92), title="Oversold Zone Color", group="Color Settings")
midColor = input.color(color.new(#9C27B0, 80), title="Middle Zone Color", group="Color Settings")

// RSI Calculation
up = ta.rma(math.max(ta.change(rsiSourceInput), 0), rsiLengthInput)
down = ta.rma(-math.min(ta.change(rsiSourceInput), 0), rsiLengthInput)
rsi = down == 0 ? 100 : up == 0 ? 0 : 100 - (100 / (1 + up / down))
rsiMA = ma(rsi, maLengthInput, maTypeInput)
isBB = maTypeInput == "Bollinger Bands"

// Plotting
rsiPlot = plot(rsi, "RSI", color=rsiColor, linewidth=2)
plot(rsiMA, "RSI MA", color=maColor, linewidth=2)

// Reference Lines
obLine = hline(overboughtLevel, "Overbought", color=color.new(#E91E63, 0), linestyle=hline.style_dashed, linewidth=1)
midLine = hline(50, "Middle", color=color.new(#9C27B0, 50), linestyle=hline.style_dotted, linewidth=1)
osLine = hline(oversoldLevel, "Oversold", color=color.new(#00BCD4, 0), linestyle=hline.style_dashed, linewidth=1)

// Background Fills
fill(obLine, hline(100), color=obColor, title="Overbought Zone")
fill(osLine, hline(0), color=osColor, title="Oversold Zone")
fill(obLine, osLine, color=midColor, title="Middle Zone")

// Bollinger Bands
bbUpperBand = plot(isBB ? rsiMA + ta.stdev(rsi, maLengthInput) * bbMultInput : na, title="BB Upper", color=color.new(#4CAF50, 0), linewidth=1)
bbLowerBand = plot(isBB ? rsiMA - ta.stdev(rsi, maLengthInput) * bbMultInput : na, title="BB Lower", color=color.new(#4CAF50, 0), linewidth=1)
fill(bbUpperBand, bbLowerBand, color=isBB ? color.new(#4CAF50, 85) : na, title="BB Fill")

// Alert Conditions
rsiOverbought = ta.crossover(rsi, overboughtLevel)
rsiOversold = ta.crossunder(rsi, oversoldLevel)

alertcondition(rsiOverbought, title="RSI Overbought Alert", message="RSI has crossed above {{plot_0}} level (Overbought)")
alertcondition(rsiOversold, title="RSI Oversold Alert", message="RSI has crossed below {{plot_0}} level (Oversold)")

// Optional: Crossover alerts for MA
maCrossUp = ta.crossover(rsi, rsiMA)
maCrossDown = ta.crossunder(rsi, rsiMA)

alertcondition(maCrossUp, title="RSI Crosses Above MA", message="RSI crossed above its moving average")
alertcondition(maCrossDown, title="RSI Crosses Below MA", message="RSI crossed below its moving average")
アラートのトリガーを、「バーの終値毎に1回」にすると、買われすぎ売られすぎにある間鳴り続けます。
「うるさい!」という人はアラートトリガーを「1回限り」にして毎回作動させるといいですよ。
もしRSIの買われすぎ売られすぎの値を自由に設定したアラートが欲しいという方はコチラがおススメです。

【自作無料】RSI 買われすぎ売られすぎカスタム設定アラートインジケーター
RSIカスタムアラートは、RSIとそのMAのクロスやオーバーボート/オーバーソールドレベルに基づいてアラートを発します。ユーザーはパラメータを調整でき、効果的なトレーディングをサポートします。

コメント