RSIの買われすぎ、売られすぎを自由に変更、その数値に応じてアラートを設定できるインジケーターを作りました。
確認不要、無料で使っていただけます。
例えば一般的なRSIは買われすぎが70、売られすぎが30ですよね。
でも60で買われすぎ、10で売られすぎに設定したとしたら、そのラインに触れるとアラートが鳴るようになっています。
RSI 買われすぎ売られすぎカスタム設定アラート
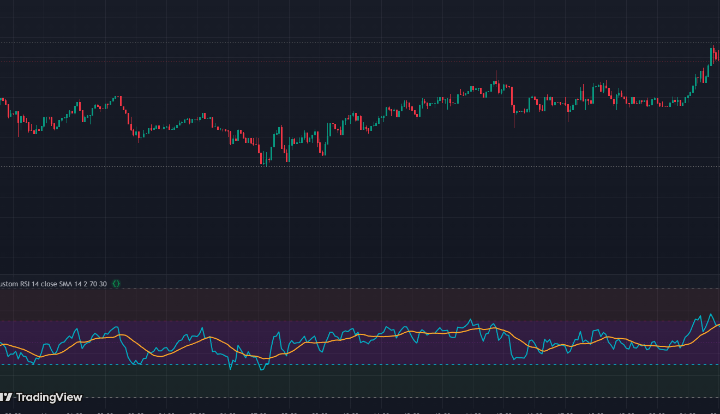
コチラがインジケーターを設置した画面です。
買われ過ぎ売られ過ぎの場所に薄い背景色を加えてあります。
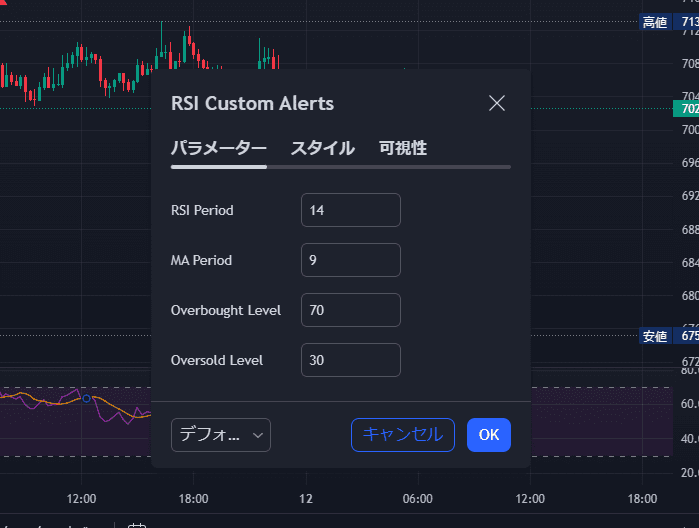
コチラがパラメータ画面。
ここでRSIの買われすぎ売られすぎに反応するアラートの数値を設定します。
「over~」の部分ですね。
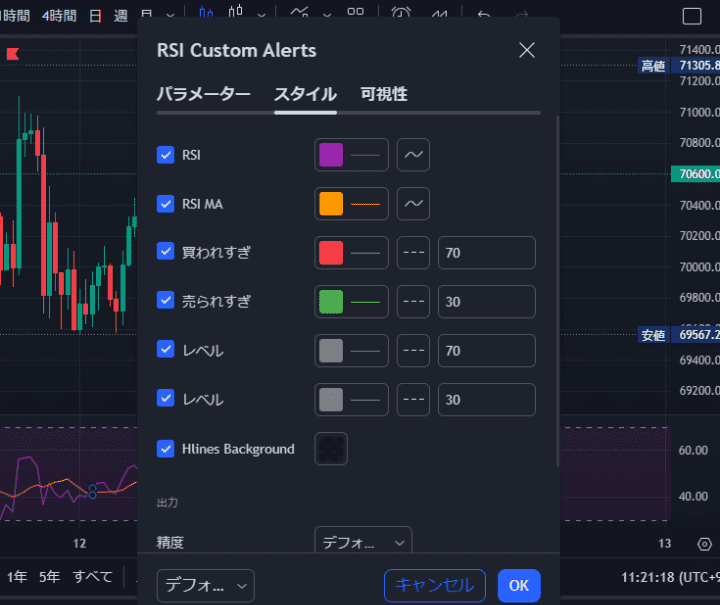
コチラがスタイル画面。
MAの表示設定や、買われすぎ売られすぎラインの設定ができます。
ここでの買われすぎ売られすぎは、あくまでビジュアル的な部分なので、アラートに反応する数値ではありません。
特に理由がなければアラートと同じ数値にしておいたほうが分かりやすいですね。
アラートの説明
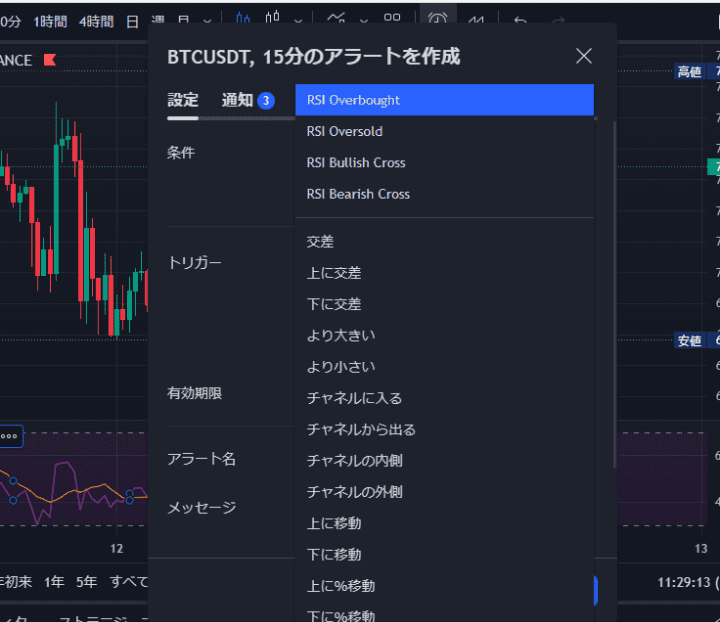
コチラがアラート設定画面。
このRSIインジケーターには4種類のアラートが設定されています:
- RSI Overbought(買われ過ぎアラート) RSIが設定した買われ過ぎレベル(設定可能)を下から上に突き抜けた瞬間
- RSI Oversold(売られ過ぎアラート) RSIが設定した売られ過ぎレベル(設定可能)を上から下に突き抜けた瞬間
- RSI Bullish Cross(強気クロス) RSI線が移動平均線を下から上に突き抜けた瞬間
- RSI Bearish Cross(弱気クロス) RSI線が移動平均線を上から下に突き抜けた瞬間
それぞれ手法に合わせて調節してください。
インジケーターコード
//@version=4
study("Custom RSI Alerts", overlay=false)

// Input parameters
rsiPeriod = input(14, title="RSI Period", minval=1)
maPeriod = input(9, title="MA Period", minval=1)
overBoughtLevel = input(70, title="Overbought Level", minval=0)
overSoldLevel = input(30, title="Oversold Level", minval=0)

// Color Settings
rsiColor = input(color.new(#00ACC1, 0), title="RSI Line Color")
maColor = input(color.new(#FFA726, 0), title="MA Line Color")
obZoneColor = input(color.new(#EF5350, 92), title="Overbought Zone Color")
osZoneColor = input(color.new(#66BB6A, 92), title="Oversold Zone Color")
midZoneColor = input(color.new(#9C27B0, 80), title="Middle Zone Color")

// Calculate RSI
rsi = rsi(close, rsiPeriod)

// Calculate MA of RSI
rsiMA = sma(rsi, maPeriod)

// Plot RSI and MA
plot(rsi, color=rsiColor, title="RSI", linewidth=2)
plot(rsiMA, color=maColor, title="RSI MA", linewidth=2)

// Plot overbought/oversold levels
obLine = hline(overBoughtLevel, color=color.new(#EF5350, 0), linestyle=hline.style_dashed, title="Overbought", linewidth=1)
midLine = hline(50, color=color.new(#9C27B0, 50), linestyle=hline.style_dotted, title="Middle", linewidth=1)
osLine = hline(overSoldLevel, color=color.new(#66BB6A, 0), linestyle=hline.style_dashed, title="Oversold", linewidth=1)

// Fill zones
fill(obLine, hline(100), color=obZoneColor, title="Overbought Zone")
fill(osLine, hline(0), color=osZoneColor, title="Oversold Zone")
fill(obLine, osLine, color=midZoneColor, title="Middle Zone")

// Alert conditions
alertcondition(crossover(rsi, overBoughtLevel), title="RSI Overbought", message="RSI has crossed above the overbought level.")
alertcondition(crossunder(rsi, overSoldLevel), title="RSI Oversold", message="RSI has crossed below the oversold level.")
alertcondition(crossover(rsi, rsiMA), title="RSI Bullish Cross", message="RSI has crossed above its MA.")
alertcondition(crossunder(rsi, rsiMA), title="RSI Bearish Cross", message="RSI has crossed below its MA.")
コチラがコードです。
アラートのトリガーを、「バーの終値毎に1回」にすると、買われすぎ売られすぎにある間鳴り続けます。
「うるさい!」という人はアラートトリガーを「1回限り」にして毎回作動させるといいですよ。
今回のインジケーターは、買われ売られ過ぎの値を自由に変更できますが、基本的な値(70で買われすぎ、30で売られすぎ)のRSIでいいという方にはコチラのインジがおススメ。
【自作無料】RSI買われすぎ売られすぎアラートインジケーター
RSIの買われすぎ売られすぎラインに到達すると、アラートで知らせてくれるインジケーターを作りました。 無料で、確認不要で使っていただけます。 デフォルトで搭載されているRSIのインジケーターにアラートを設定することはできたのですが、一度鳴る...

コメント